The Problem
Spain's rail network runs approximately 15,000 km of track and generates millions of train-kilometres of vibration and acoustic data every year. Auscultation trains — the vehicles that measure rail health — are among the most sophisticated instruments in the maintenance toolkit. The data they collect is detailed, structured, and theoretically actionable.
In practice, it arrives as a PDF.
From sensor to maintenance engineer, the chain looks like this: data is collected, processed centrally, formatted into a report, distributed by email, and interpreted by the engineer who has to decide — often in the same meeting where a dozen other things are being prioritized — where to send a crew this week. By the time a corrugation defect reaches someone with the authority to act, days or weeks have passed since it was first detectable in the signal.
The 2022 Adamuz accident put Spain's rail safety infrastructure under national scrutiny. Among the gaps it made visible: the distance between what the system knows and what reaches the people who can do something about it. BaseLine was built to address one specific part of that gap — the auscultation problem.
Research and Validation
Before building anything, I ran a structured opportunity validation of the problem space, approaching it as a UX researcher with deliberate skepticism toward "tech-solvable" framings.
The structural problems are real: periodicity gaps between auscultation passes, low signal-to-noise in raw data, fragmented visibility across field crews and control rooms, and manual escalation latency that forces reactive rather than preventive work. These are not anecdotal — they're structural to how the current inspection workflow operates.
The primary user for the MVP is one person: the maintenance triage engineer. Not drivers, not regulators, not operations controllers, not executives. The triage engineer already makes prioritization decisions, already feels the pain of late detection, and can act without changing train operations. Every other user group was explicitly out of scope for the first version.
Strong problem, high complexity, significant adoption risk. The recommendation: do not build a full platform first. Start with one defect class, one corridor, one user group. Prove that earlier detection changes behavior before expanding anything.
High false-positive rates cause rapid abandonment. Black-box predictions are ignored or distrusted. Union concerns about surveillance and blame are real blockers. Any system that implies "missed defects" creates liability tension with regulators. These are not UX problems — they are political and organizational constraints that had to shape the design from the start.
The MVP Wedge
The scope definition was as important as any design decision in the project. The wedge was chosen to be narrow enough to survive organizational politics, useful enough to change behavior, and legible enough to earn trust from regulators and engineers.
Rail corrugation produces distinct acoustic and vibration signatures, develops gradually (giving time for detection and response), and is already well-understood by maintenance engineers — which makes trust calibration easier. High-speed AVE lines were explicitly excluded from the MVP: the political and safety risk is too high to begin there.
A single high-traffic commuter corridor with mixed rolling stock and known historical maintenance issues. The primary job: "help you decide where to look first this week." Not prediction. Not replacement of inspections. Not real-time alerting. Triage support for the weekly prioritization decision engineers are already making.
What the MVP explicitly does not do: It does not alert drivers in real time. It does not trigger automatic slow orders. It does not replace inspections. It does not rank crew or driver performance. It does not provide predictive failure timelines ("failure in X days"). Each of these non-goals was a deliberate choice to reduce adoption friction and liability risk.
What I Designed
The prototype is a web-first triage interface built in Figma Make — a working React application, not a mockup. It has two primary views.
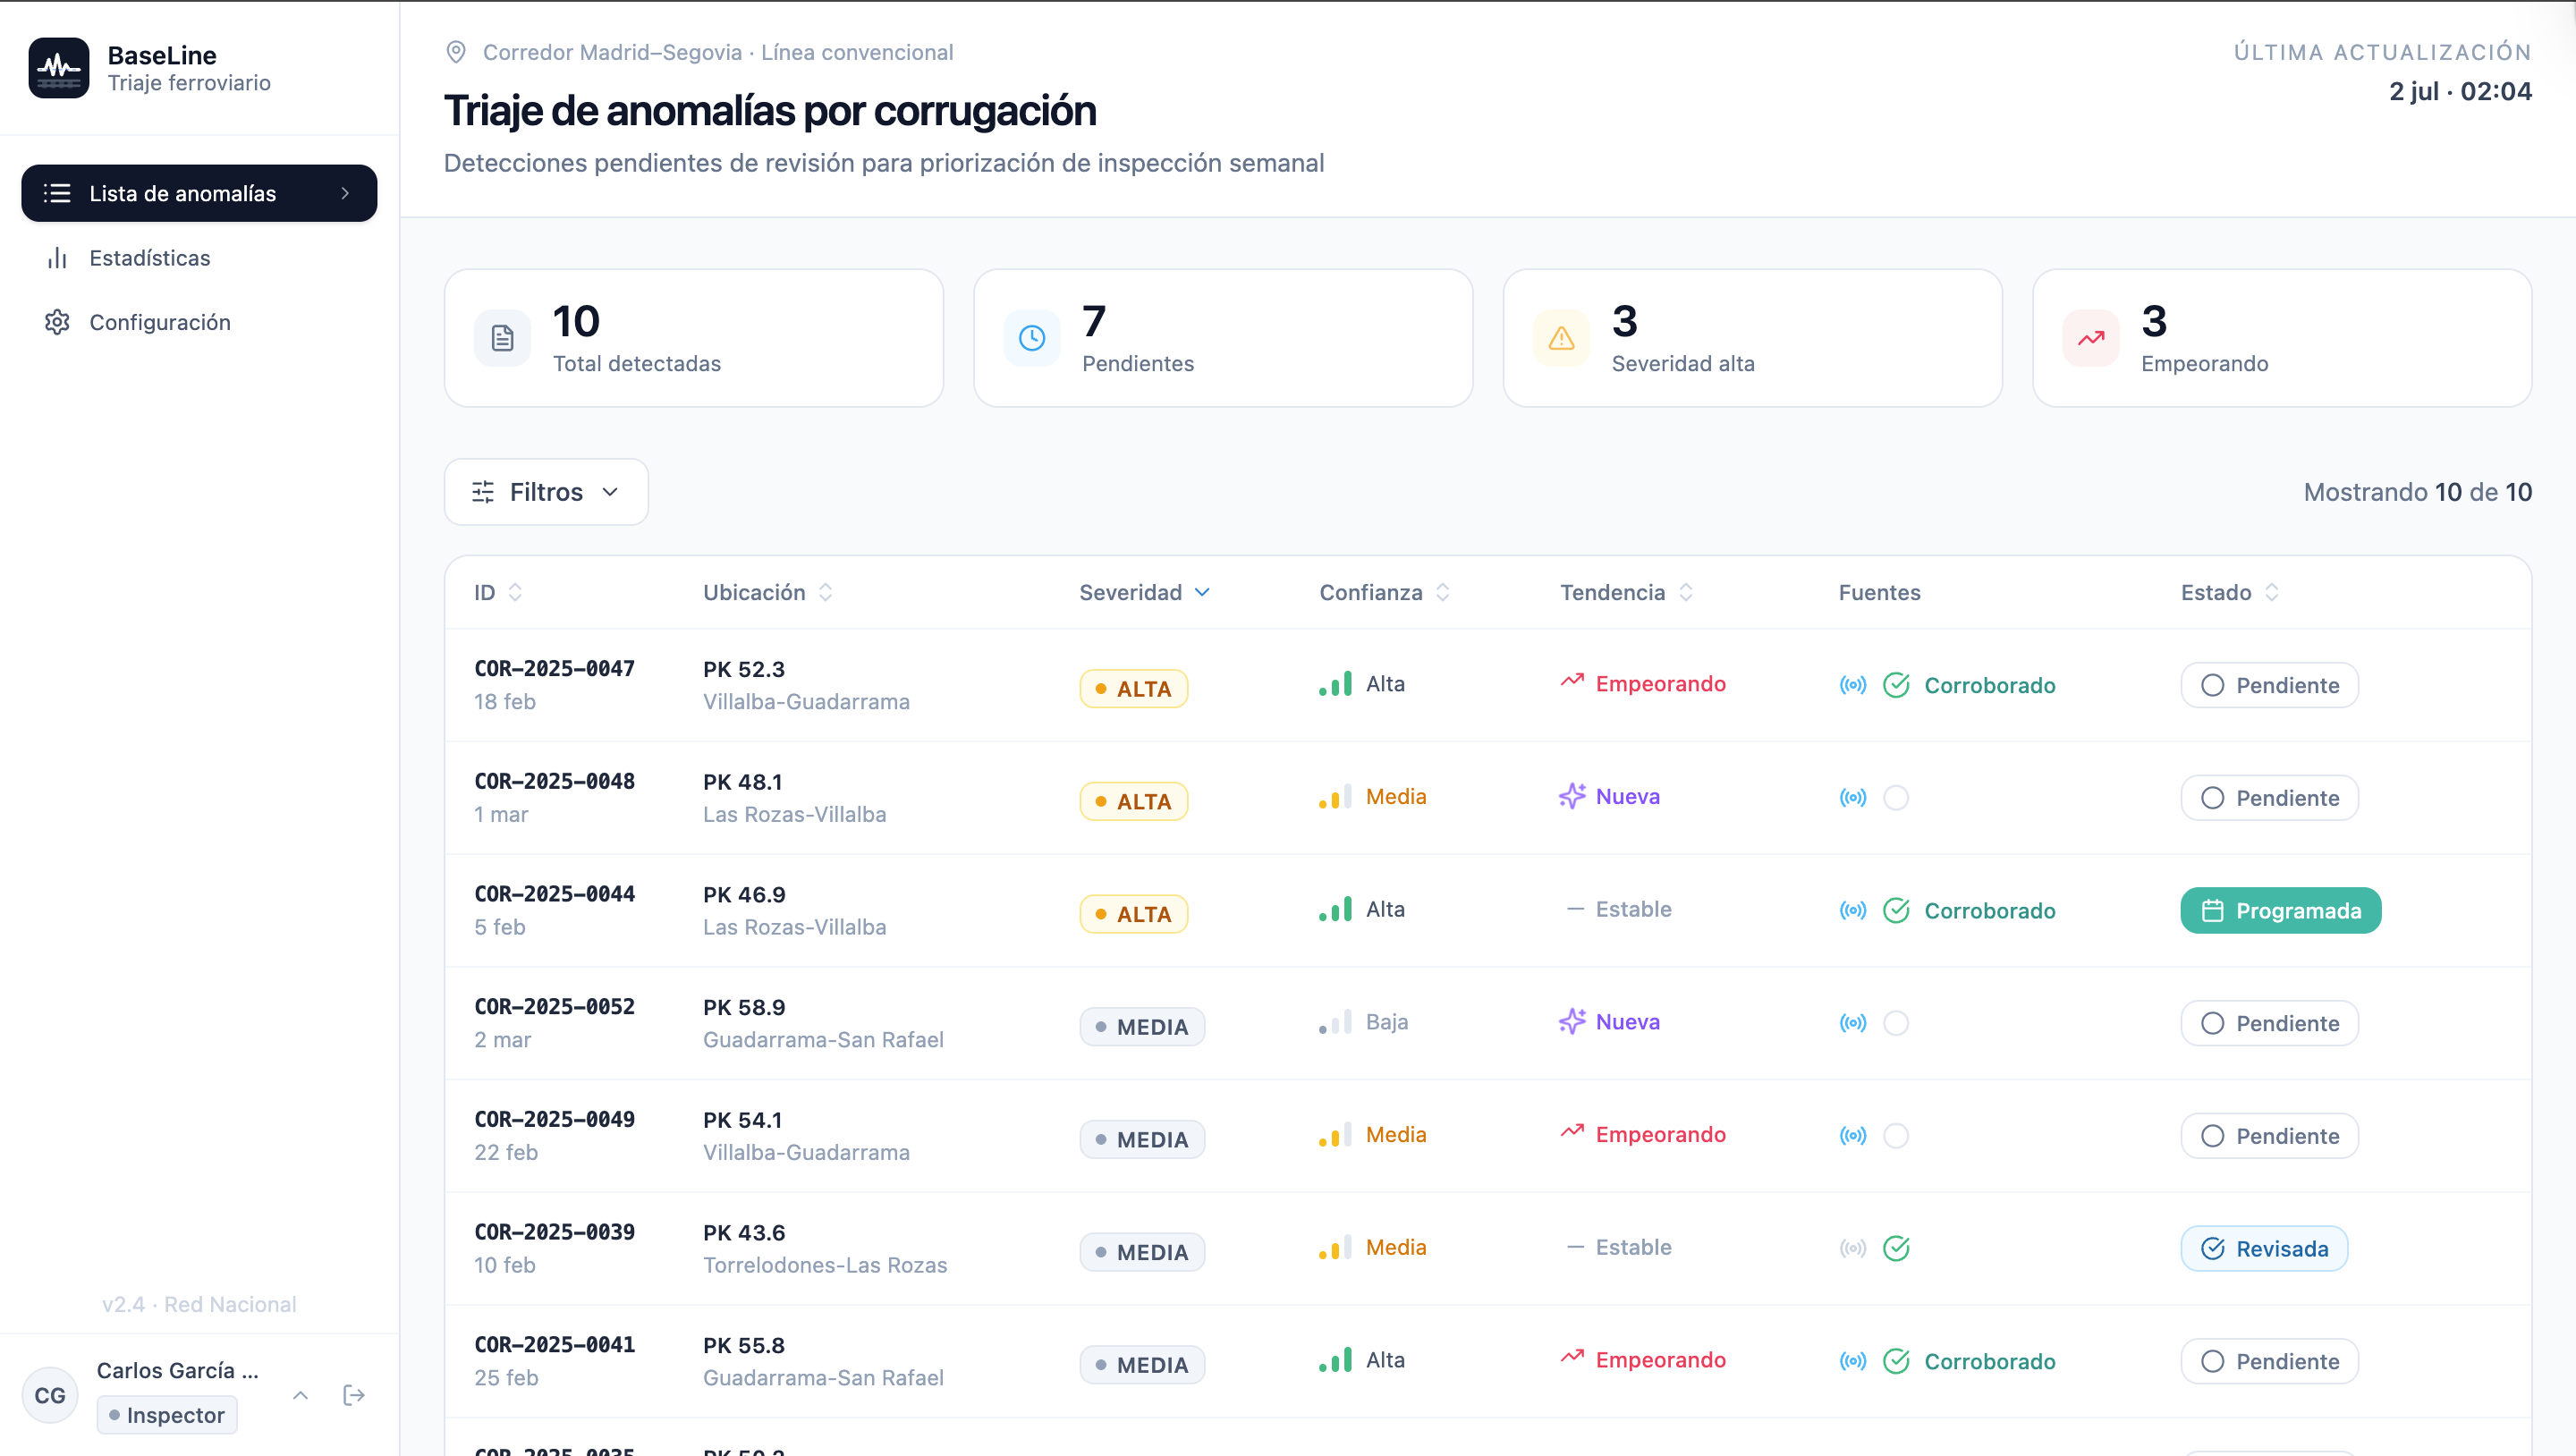
Anomaly list — the triage view
The primary screen is a sortable, filterable table of detected anomalies for the corridor. Four KPI cards at the top give the engineer an immediate read on the current situation: total detections, pending review, high severity, and worsening trend. Every row shows the five signals needed to make a triage decision without clicking through: location (PK marker), severity band, confidence level, trend direction, and corroboration status. Filters collapse to severity, confidence, trend, and status — no more, no fewer.
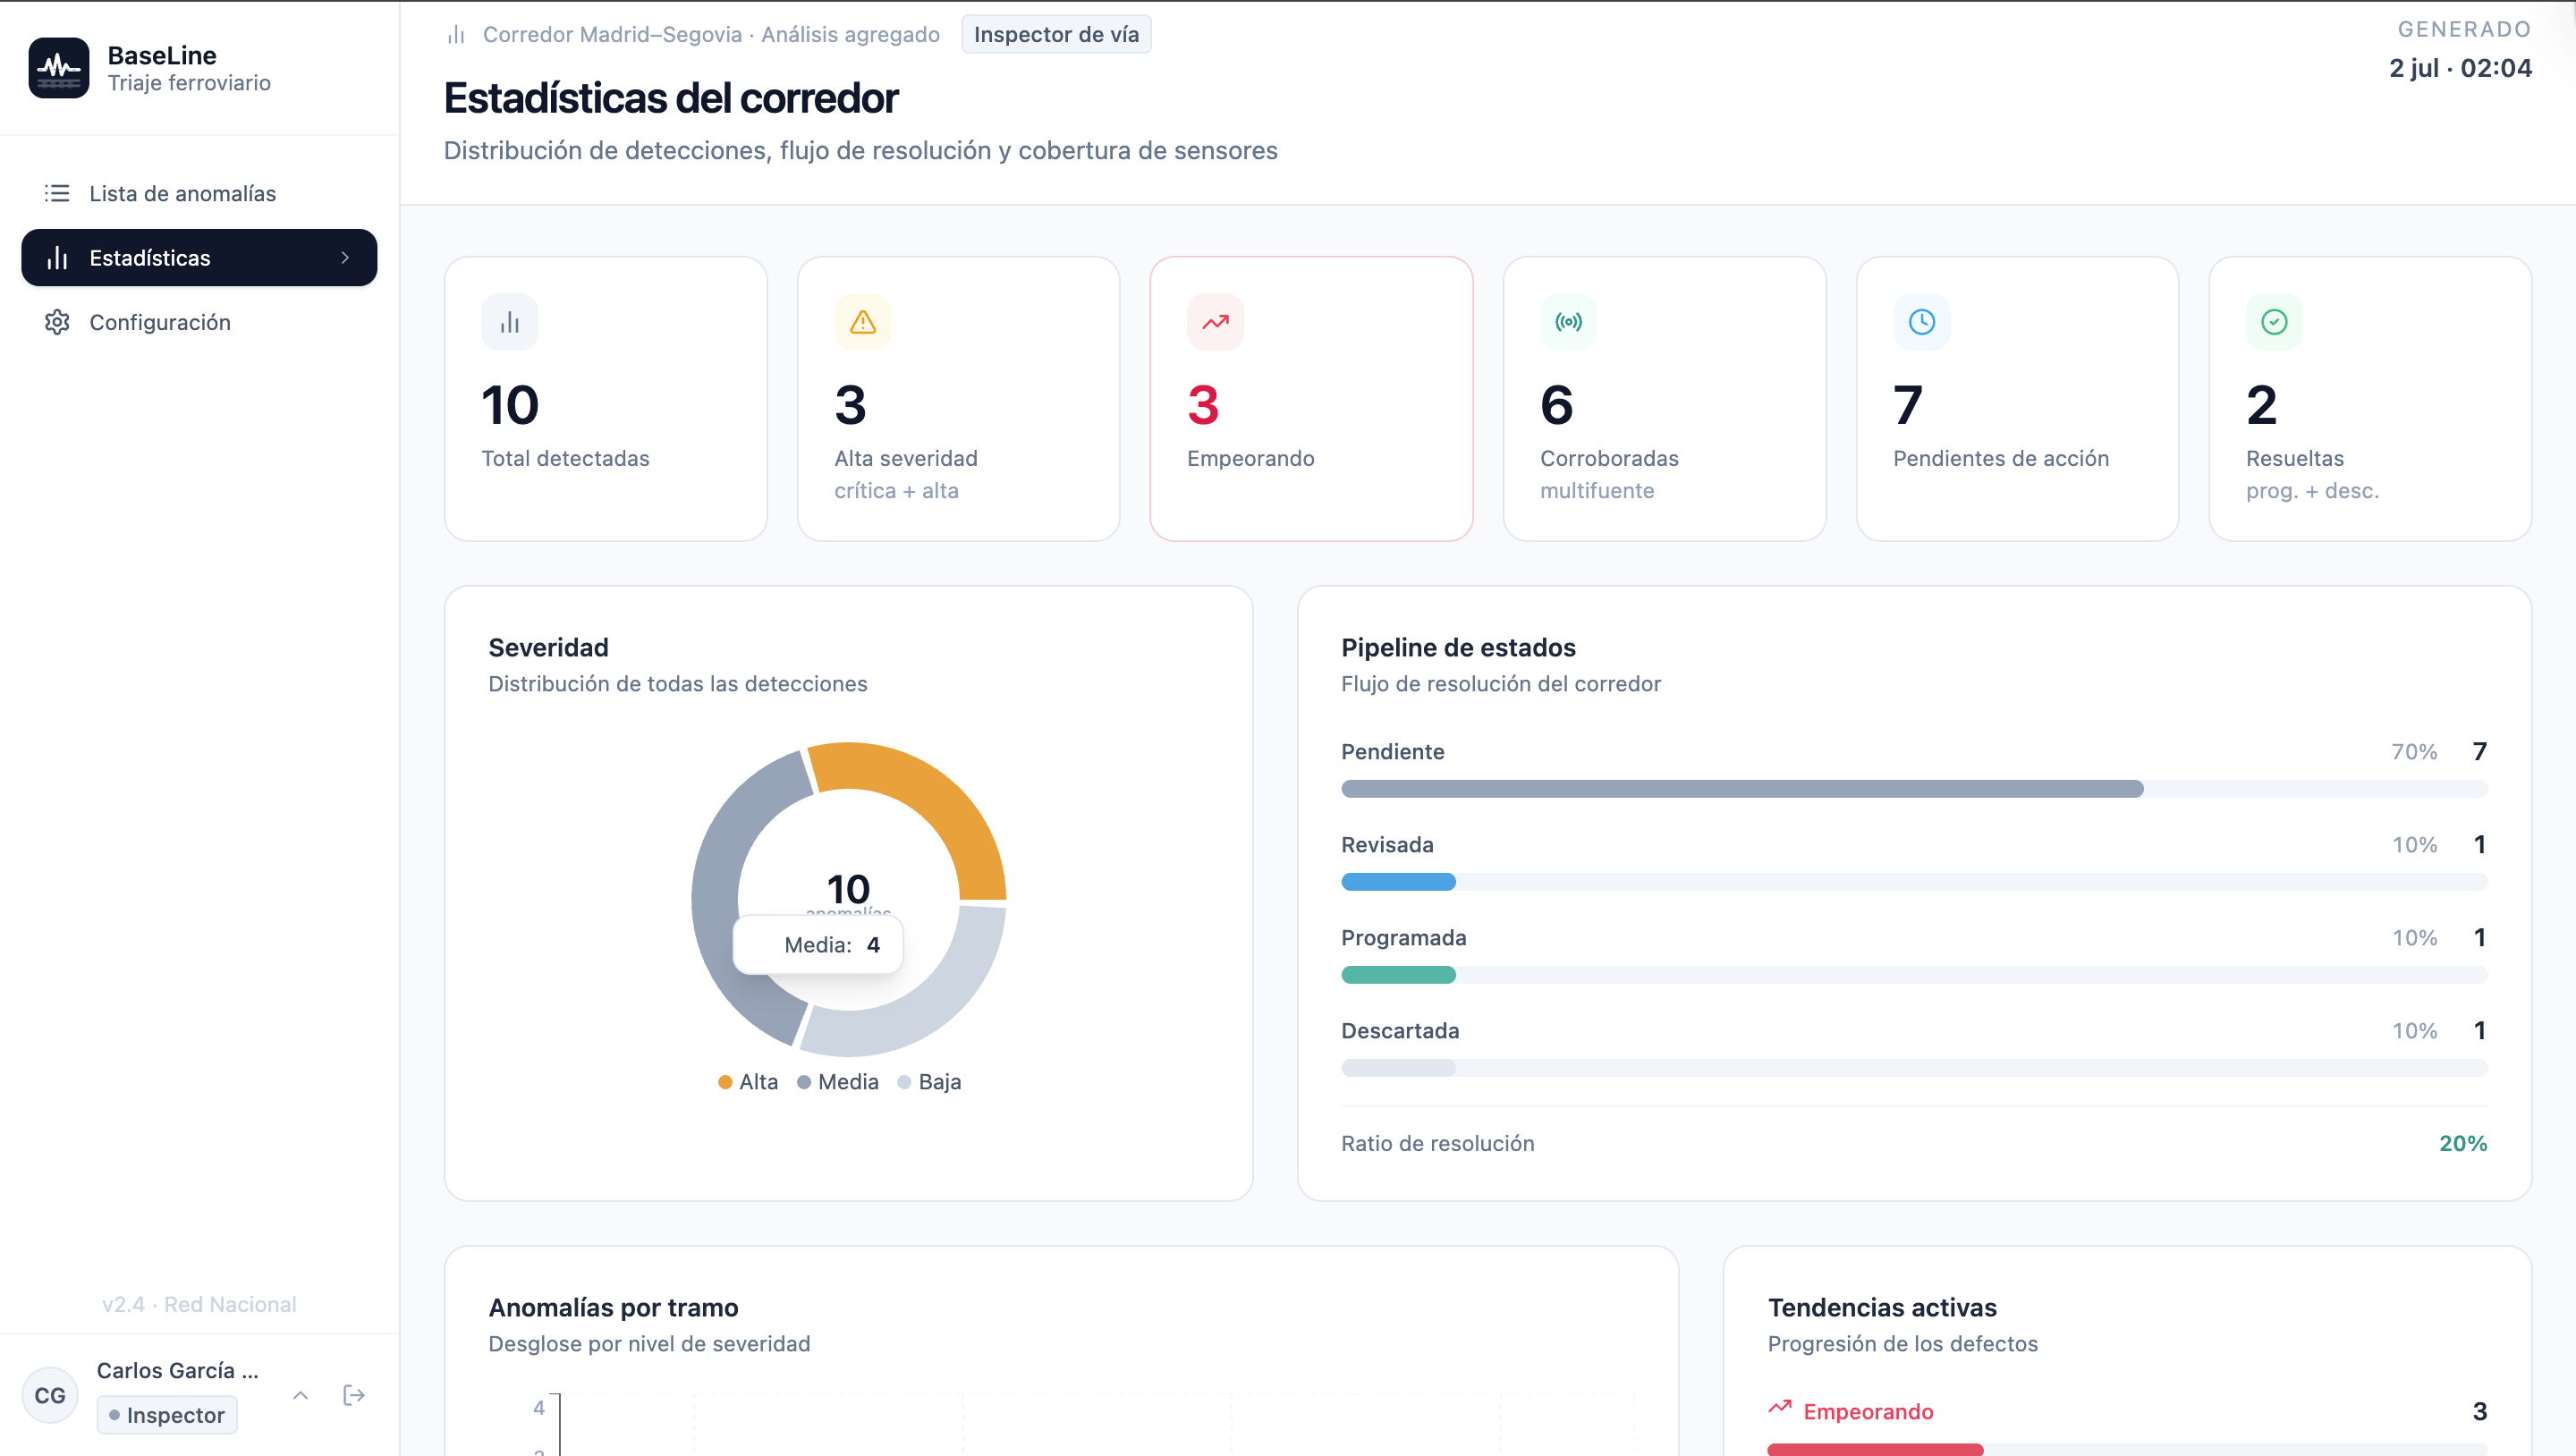
Anomaly detail — the decision view
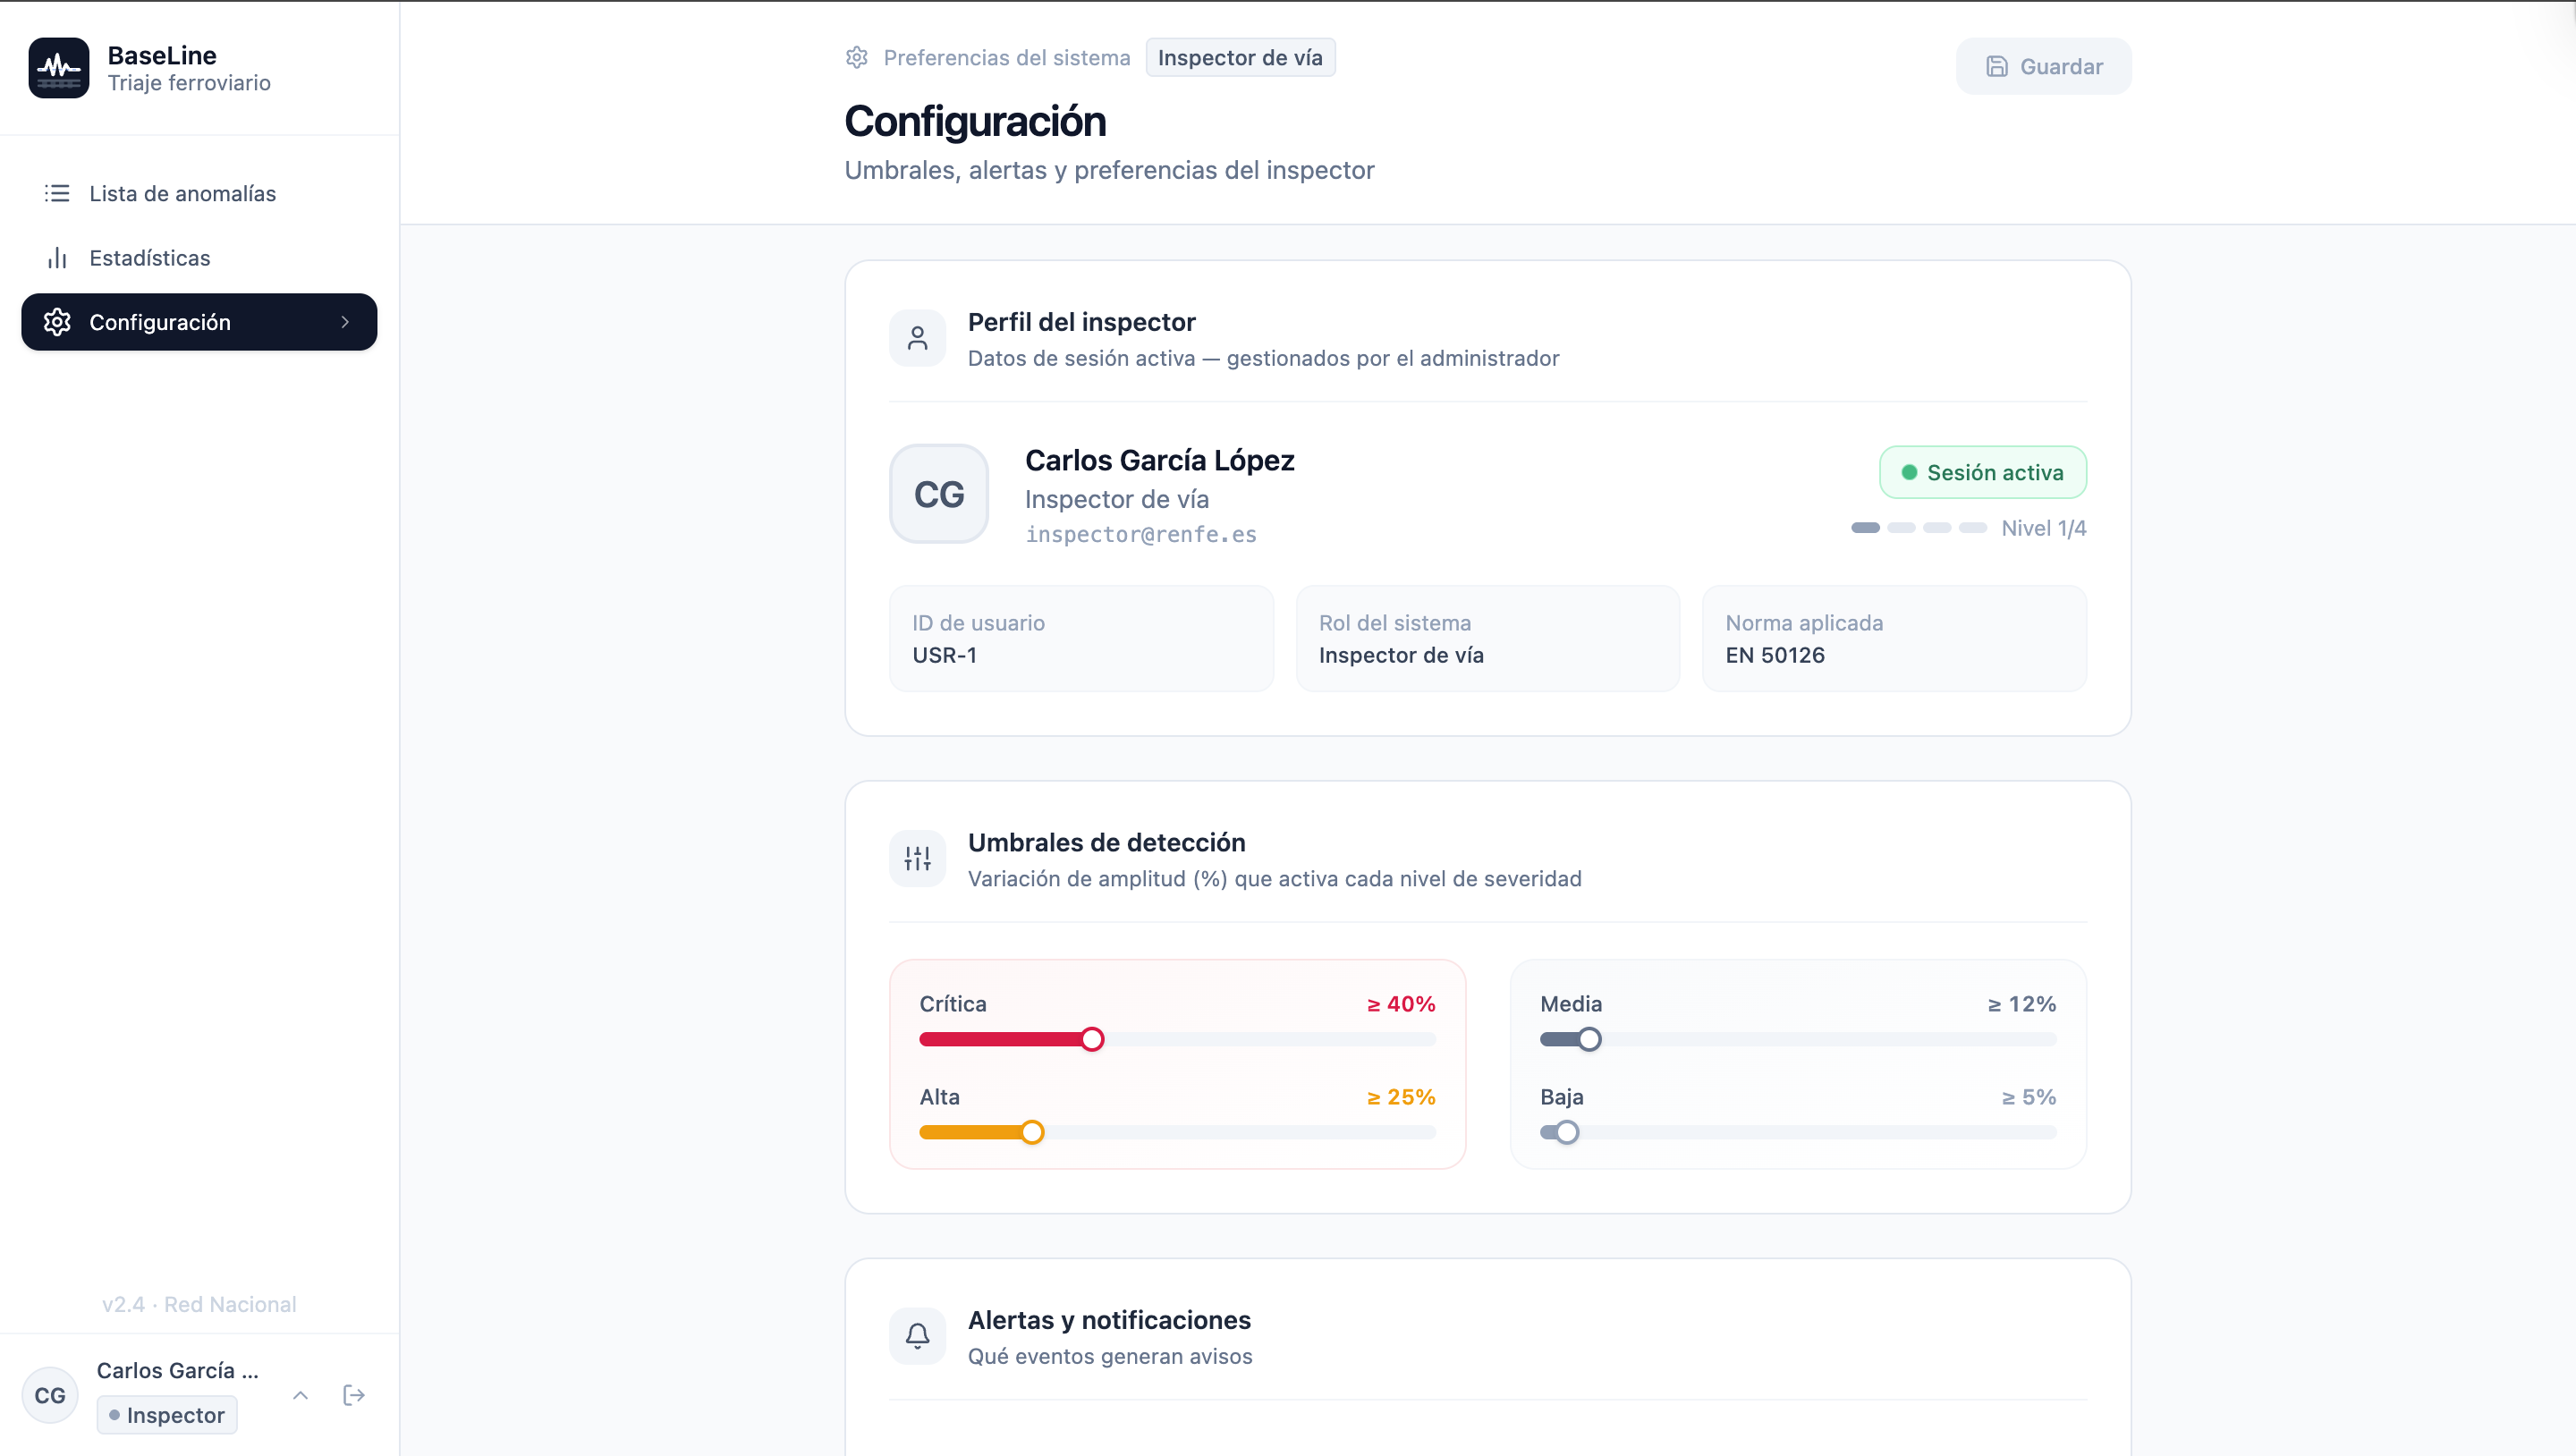
Configuration — engineer-controlled thresholds
Engineers can adjust detection thresholds per defect class directly in the interface. Every change is logged. This is not a setting buried in an admin panel — it is a first-class workflow because calibration is part of the trust relationship between the engineer and the system.
Clicking through reveals the evidence behind the detection: a 52-pass signal chart showing the raw vibration history and threshold, a plain-language explanation card, corroboration status from named sensor sources, and the full technical context (PK location, section, amplitude change %, consecutive confirmatory passes). The action panel on the right is the only place the engineer interacts with the system: reviewed, inspect next cycle, schedule maintenance, false positive. Every decision is logged with the user's identity and a timestamp.
Key Design Decisions
Every anomaly card leads with a plain-language explanation of what was detected and why the system flagged it: "Sustained increase in lateral vibration amplitude on the right rail. Values exceeded the established threshold in 7 of the last 10 measurement passes. Evolution pattern suggests a possible long-pitch corrugation defect. Confirmed independently by wayside sensor and auscultation train." The engineer reads the evidence before they see the severity label — not the other way around. This is a deliberate inversion of how most alerting systems are designed.
Every anomaly shows whether it has been confirmed by more than one independent source. Corroborated detections are marked; single-source detections are not. This single visual signal does significant work: it calibrates the engineer's confidence before they read anything else, it reduces the cognitive cost of prioritization, and it makes the system's own uncertainty legible rather than hidden. An uncorroborated high-severity detection should be investigated — but differently from a corroborated one.
The detail view includes a persistent note: "Decisions logged here are associated with your user and date. The system does not execute automatic actions on infrastructure." This is not a disclaimer. It is the core safety commitment of the design. A triage tool in a safety-critical domain that takes automatic action — or implies it might — will be distrusted, circumvented, or blocked by regulators. The human is always the decision-maker. The system's job is to give them better information, faster.
The MVP is deliberately narrow: one defect class, one corridor, thresholds tunable by engineers. The design principle behind this is that high false-positive rates are the fastest path to abandonment in a safety-critical workflow. An engineer who dismisses three alerts without action will not check the fourth. Precision matters more than recall at this stage. The expansion to more defect types, more corridors, and richer data streams follows only after the system has earned operational trust.
In safety-critical systems, value doesn't come from sophisticated algorithms. It comes from human-data coordination, explainability, reduced operational friction, and design oriented toward real adoption.
Live Prototype
Built in Figma Make — a working React application, not a mockup. Open the full-screen version to interact with the anomaly list, click through to a detail view, and use the action panel.
Pilot Proposal
BaseLine is designed to be validated in a 90-day operational pilot before any commitment to broader rollout. The pilot is structured to produce binary evidence: do engineers act differently because of it, or not?
Access to existing auscultation train data for one corridor — no new hardware beyond pilot scale. Four to six maintenance triage engineers participating in fortnightly review sessions. A commitment that pilot recommendations do not trigger liability unless the engineer chooses to act on them.
Primary success signal: 30% or more of anomalies reviewed result in a changed inspection or maintenance priority. Secondary signals: engineers report earlier awareness of defects they would not have caught as soon; false-positive rate stays within self-declared tolerance; zero operational incidents caused by pilot recommendations. Failure signal: tool is checked once and ignored; alerts are dismissed without review; engineers request PDFs instead.
Second defect class (wheel burns). Driver-submitted corroboration (post-stop only, no interaction while moving). Expanded corridor coverage. Mobile read-only companion. Predictive maintenance planning layer. Each step is contingent on the previous one proving behavioural impact — not on technical capability to build it.
The prototype is complete and documented. Integration specification, UX research facilitation, and pilot design are available. Interested parties can reach me at design.perex@gmail.com or book a 30-minute call.
Outcome
A working prototype validated against a structured research framework, with a sharply scoped MVP definition and a concrete pilot proposal. BaseLine is not a concept — it is a decision-support tool that can be put in front of maintenance engineers and evaluated against measurable behavioral outcomes within 90 days.
The research, the prototype, and the pilot framework are available. The next step is an operator partner.