The Problem
Barcelona faces accelerating urban heat island effects. Neighborhoods like Nou Barris and Sant Martí are projected to exceed 50°C surface temperature by 2040. The city has the data — AEMET readings, Copernicus satellite measurements, census-level vulnerability indices, decades of urban planning records.
What it lacked was a way to turn that data into decisions across two radically different contexts: the urban planner running long-term intervention simulations at a Monday morning council meeting, and the resident navigating home safely on a 38°C Tuesday afternoon with a child in tow.
Existing tools were built for one audience or neither. Weather apps don't support policy decisions. Planning dashboards don't help residents find shade. A single unified app would serve both poorly — and in a safety-adjacent context, "poorly" isn't acceptable.
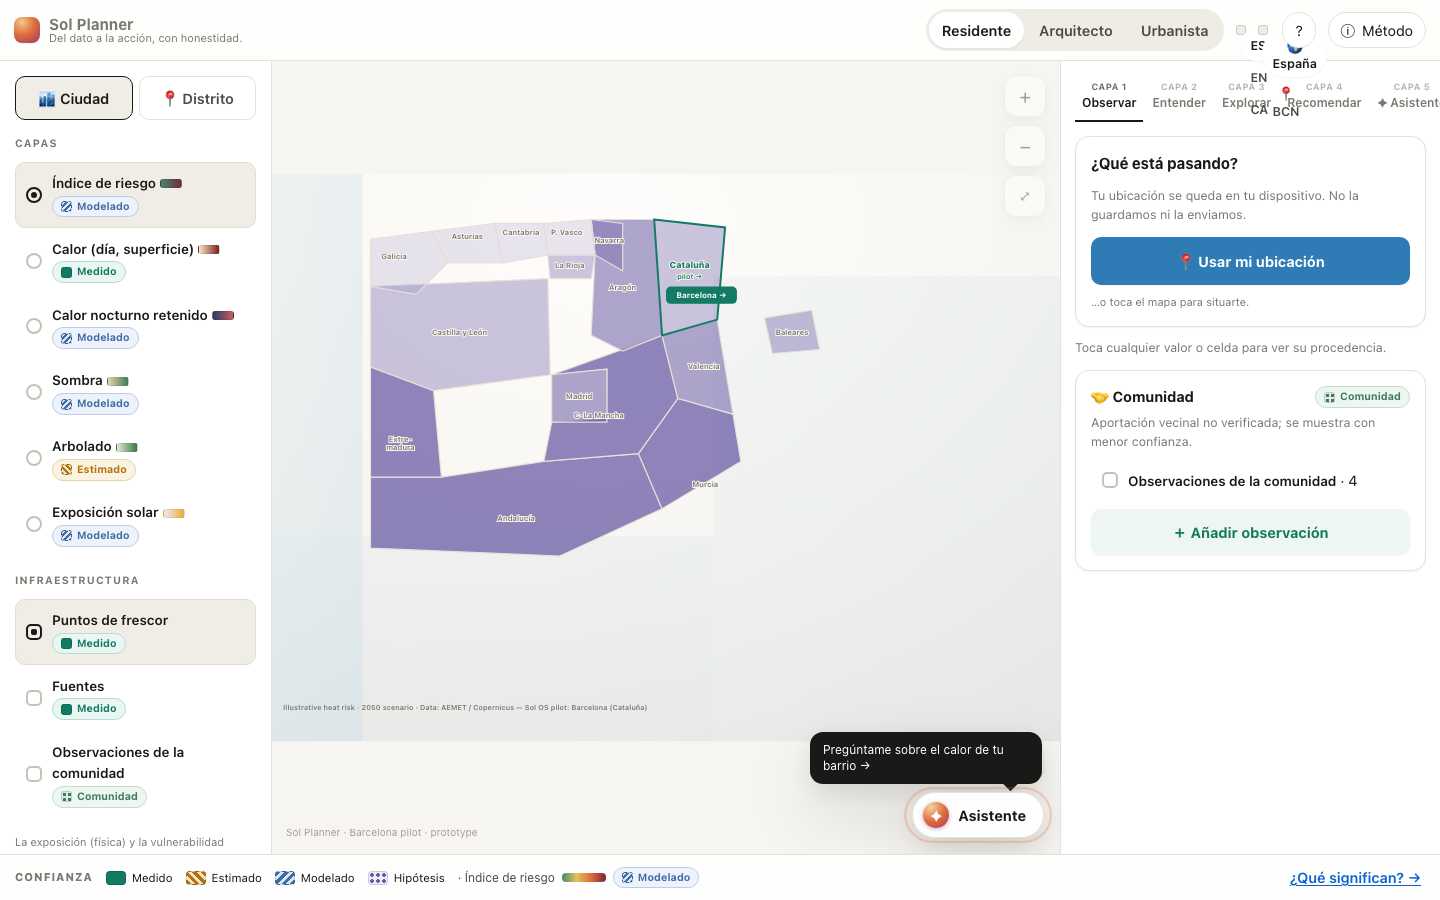
Research
Before building anything, I ran a structured research sprint to validate whether the problem warranted a product — and to understand whether one product could actually serve both audiences.
Three urban planners (two from Barcelona's Àrea de Medi Ambient i Serveis Urbans, one independent), two residents from high-vulnerability neighborhoods (Nou Barris and Besòs i Maresme). The planners spoke in data layers and policy cycles. The residents spoke in routes and heat and children. They didn't share a vocabulary for the same problem.
AEMET heat warnings (broadcast-only, not actionable at the individual level), OpenWeatherMap (real-time temperature without context), existing Barcelona city heat maps (planner-facing, not resident-accessible, not updated in real time), Copernicus Urban Atlas (excellent data, entirely inaccessible to non-specialists). None served residents. None let planners run what-if scenarios. None were honest about data confidence.
Planners and residents don't just have different needs — they have different mental models of what urban heat even is. A planner thinks in surface temperature differentials across census tracts. A resident thinks in "which street is shaded at 4pm." The same underlying data can answer both questions. The interface that answers one is useless for the other.
Barcelona's Pla del Clima 2018-2030, the Pla d'Arbrat 2017-2037 (targeting 30% canopy cover), the Superblocks programme, and the city's digital sovereignty charter — which explicitly supports civic tech that keeps data processing local and avoids surveillance infrastructure. Sol OS was designed to align with every one of these commitments.
Architecture Decision: One Product Becomes Two
The original prototype was a single application with a role toggle: Resident / Architect / Planner. In theory, each role got a different view of the same map. In practice, this was a paper compromise.
The cognitive tasks are fundamentally different. A planner needs to load multiple data layers simultaneously, run intervention simulations, export policy-ready reports, and compare neighborhoods over time. A resident needs one thing: get home without a heat emergency. These two needs don't share a UI. They don't share an information architecture. They barely share a design language.
The architecture decision: split into two products with a shared data layer, distinct deployment contexts, and separate design systems that reference the same Sol OS visual identity.
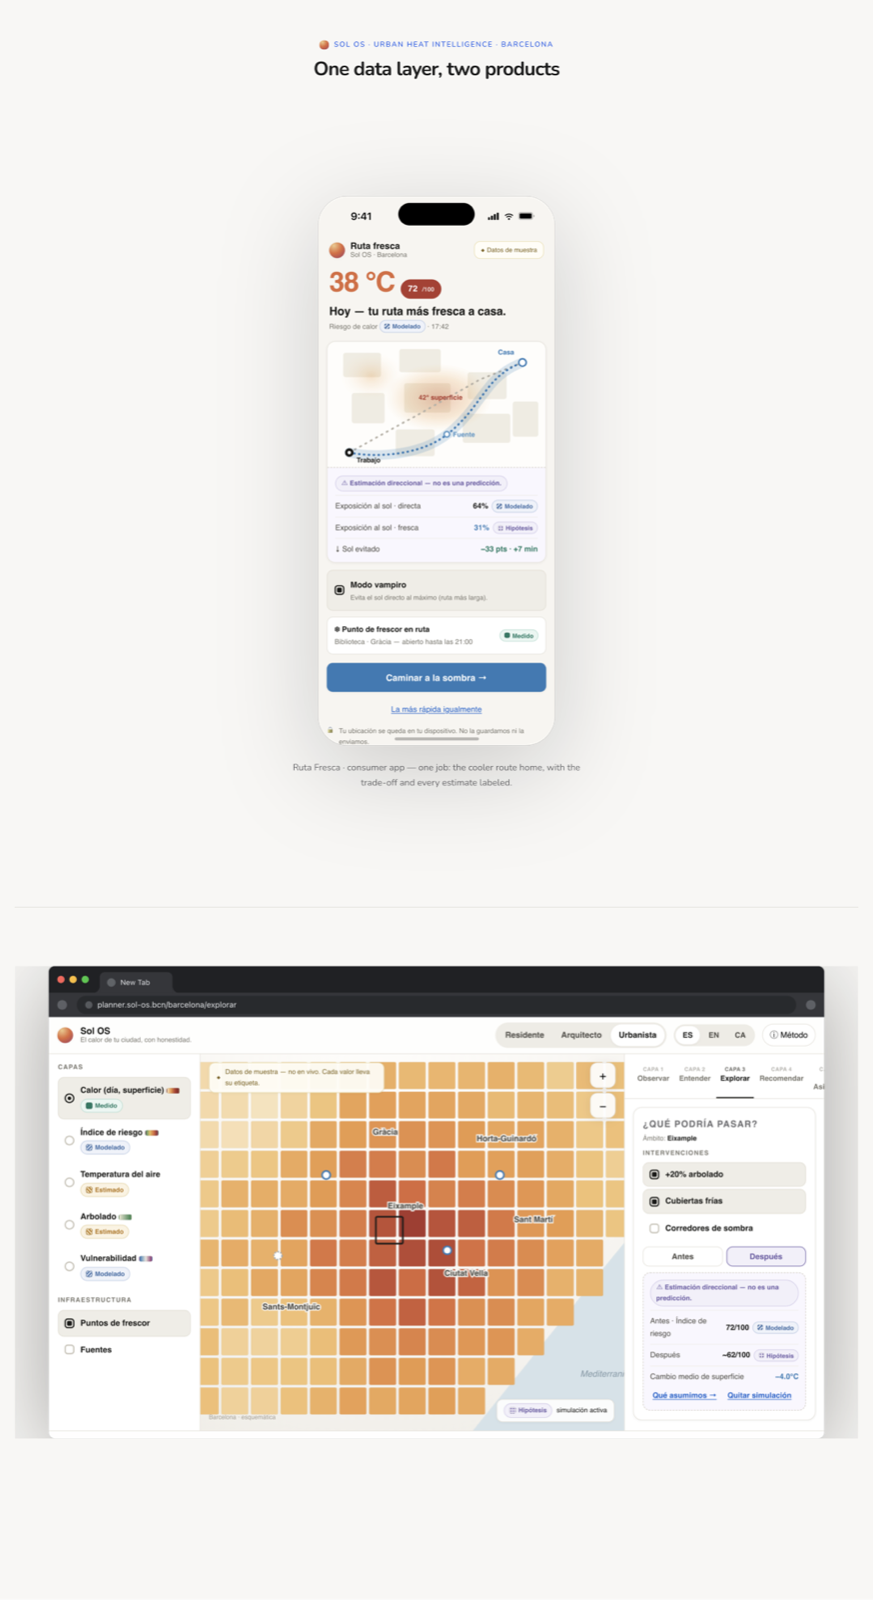
Sol Planner — The Professional Tool
Sol Planner is a desktop web application for municipalities. Its primary users are urban planners, climate adaptation officers, and infrastructure teams. The job is analysis, simulation, and policy support — not navigation.
The core interaction model is a five-layer decision platform: every data point carries an explicit confidence label (Measured, Estimated, Modeled, or Illustrative). Planners can filter by confidence tier, run what-if scenarios for interventions like canopy expansion or cool roof installation, and export findings as structured reports for city council.
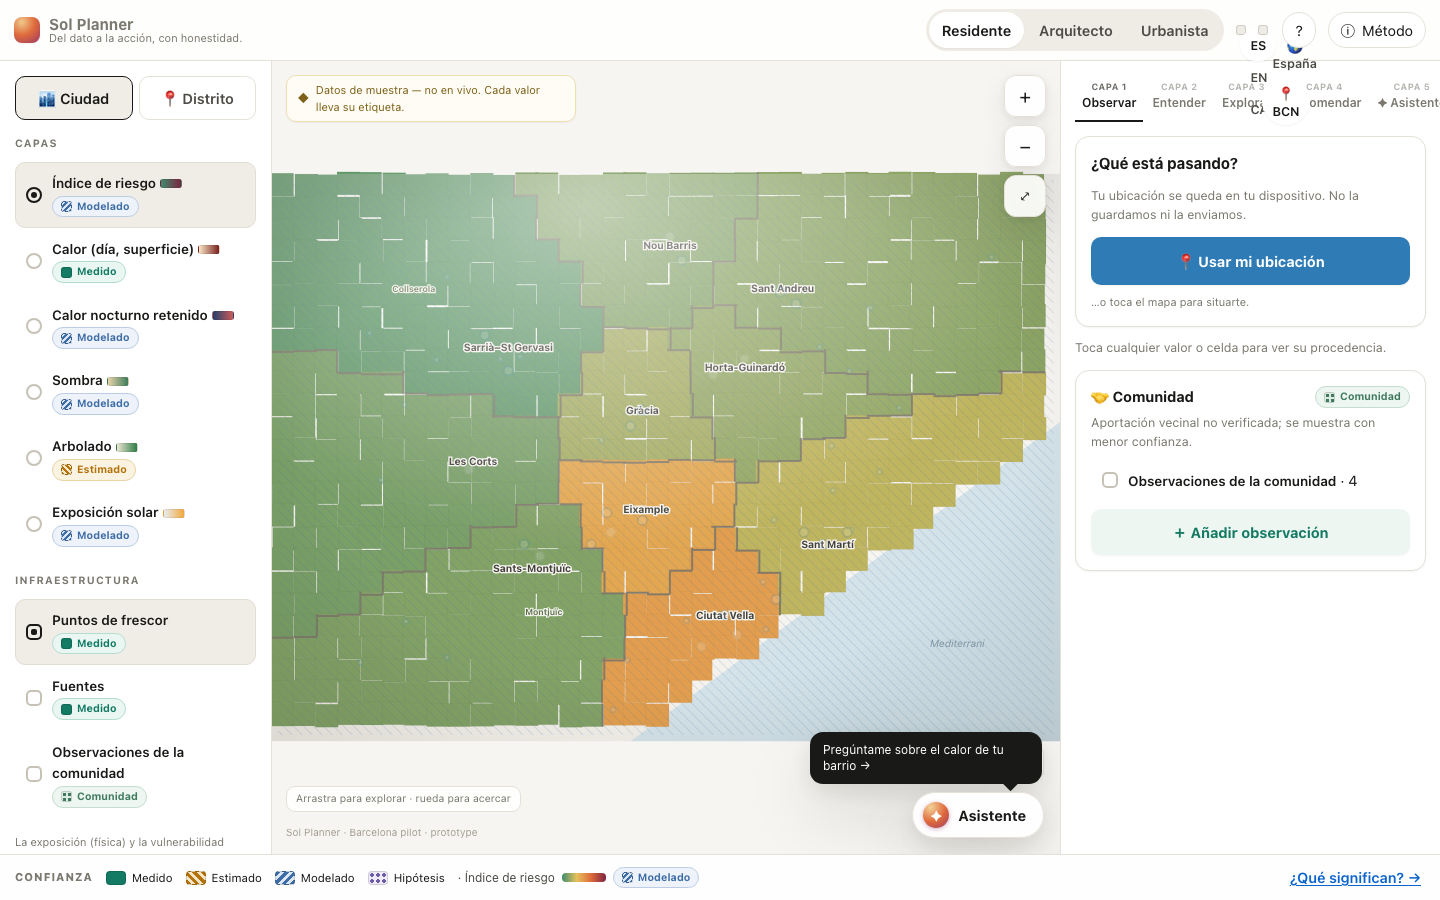
The Five-Layer Confidence Model
In climate data, certainty is not binary. Measured data (from AEMET ground stations) carries different weight than modeled projections (from urban heat simulation). Showing both on the same map without distinguishing them is not just bad UX — it is professionally misleading.
Sol Planner labels every data layer with one of four confidence tiers, each with a distinct visual treatment:
- Measured — direct sensor readings. Solid color, full opacity.
- Estimated — interpolated from adjacent sensors. Diagonal hatching.
- Modeled — computational simulation output. Cross-hatching.
- Illustrative — scenario hypothesis (what-if interventions). Dot pattern, clearly marked.
Planners and engineers who use data to make public decisions told us clearly: they need to know what they can stand behind. Confidence labeling is not a disclaimer — it is the product's primary trust mechanism.
Decision Log
Significant product choices made during the design and architecture process — with the rationale behind each one.
Barcelona has strong open data infrastructure (AEMET, Copernicus, INE census), demonstrated political will (Superblocks, tech sovereignty charter), and a clear procurement path through the Àrea de Medi Ambient. National scale is validated second — not assumed.
In high-stakes contexts — health, safety, public policy — black-box recommendations are ignored or distrusted. Every data point in Sol OS carries a confidence label. Users see what they can trust before they act on it. This is not a disclaimer system; it is the product's core trust architecture.
Architects have professional tooling. Residents and planners sit on opposite ends of the impact flywheel — one lives the problem, one can fix it at scale. Designing for both creates a platform with both upstream influence and downstream adoption. Designing for architects would have produced a niche B2B tool.
The Sol Planner prototype is one HTML file with no build pipeline, no backend, no API keys. It runs in any browser, can be emailed, can be demoed on a projector, can be handed to a city councillor on a USB drive. This was a design constraint that made the product more demonstrable and more honest about what a pilot requires.
The original mode toggle (Resident / Architect / Planner) was a paper compromise. A planner running policy simulations and a resident finding a cool route home do not share cognitive context, deployment environment, or update cadence. Two products, one data layer. The split is architectural, not cosmetic.
Showing imprecise data honestly is better UX than showing precise data dishonestly. "This is modeled, not measured" is more useful than a confident number that overstates certainty. In climate contexts especially, users who are misled by false precision stop trusting the system entirely — and that failure mode is irreversible.
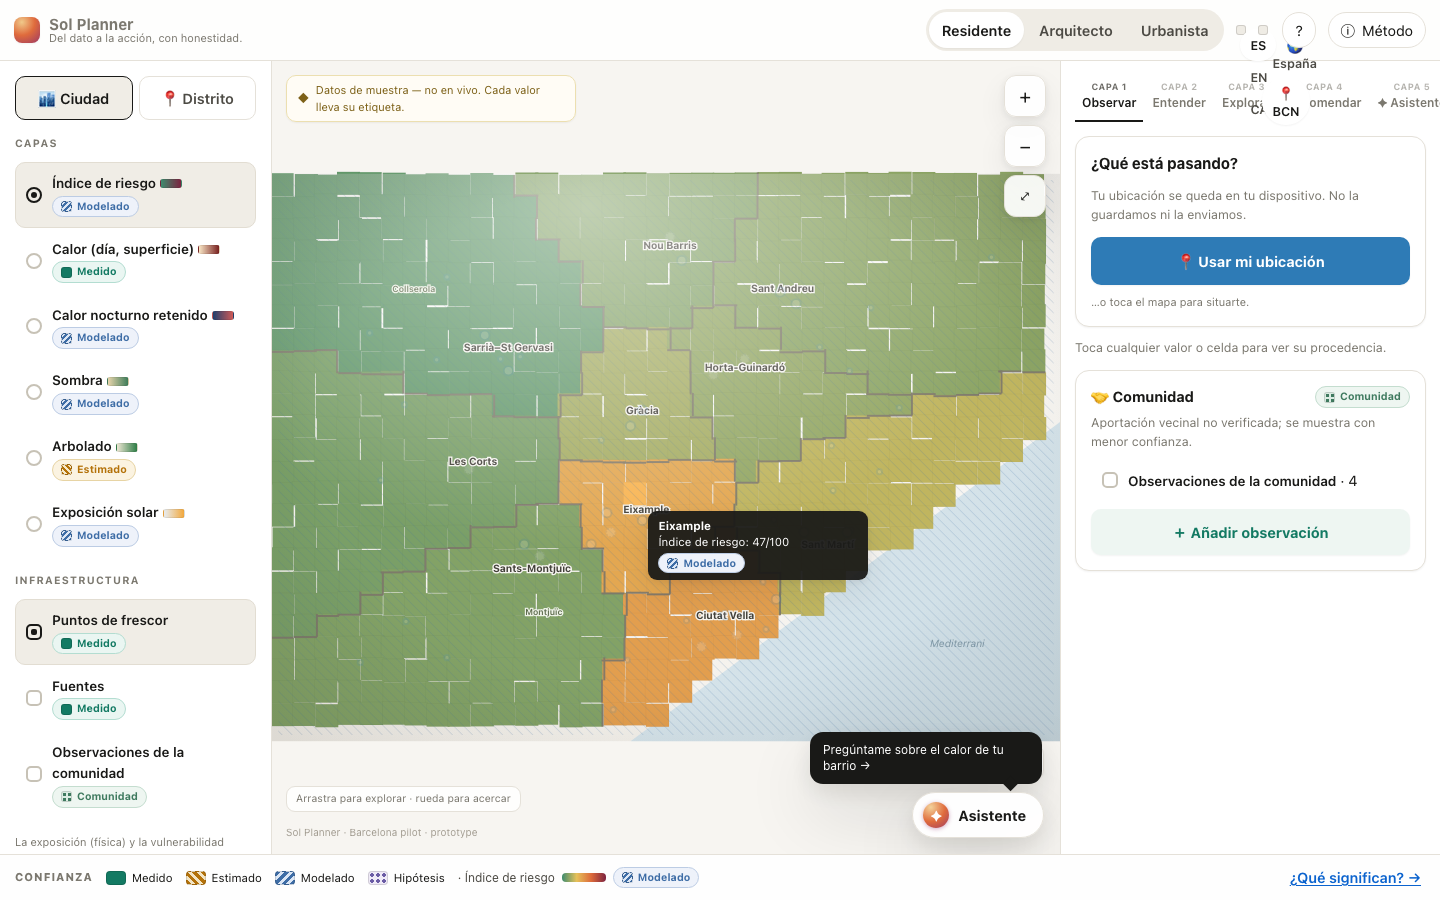
Sol Planner — Interactive Prototype
The prototype is a working single-file application — not a mockup. It runs with no backend, no API calls, and no build process. Every interaction is functional: layer toggling, neighborhood selection, intervention simulation, confidence filtering, and the climate assistant.
Ruta Fresca — The Citizen Experience
Ruta Fresca
The citizen-facing product in the Sol OS family. Where Sol Planner is data-dense and policy-linked, Ruta Fresca is radically simple: one job, one question, one answer.
"How do I get home safely today?"
- Cool route navigation (shade-aware pathfinding)
- Neighborhood heat alerts (hyperlocal, real-time)
- Cooling center finder (offline-capable)
- Hydration and rest reminders
- Vulnerable population guidance
- AI Climate Guide (deterministic, confidence-labeled)
- No account required
- Location stays on-device
Status: Concept / Design exploration — prototype not yet built.
Ruta Fresca is designed to be funded and distributed as public infrastructure — not a consumer subscription. We are seeking a city partnership to pilot it as a public service, co-designed with residents from high-vulnerability neighborhoods.
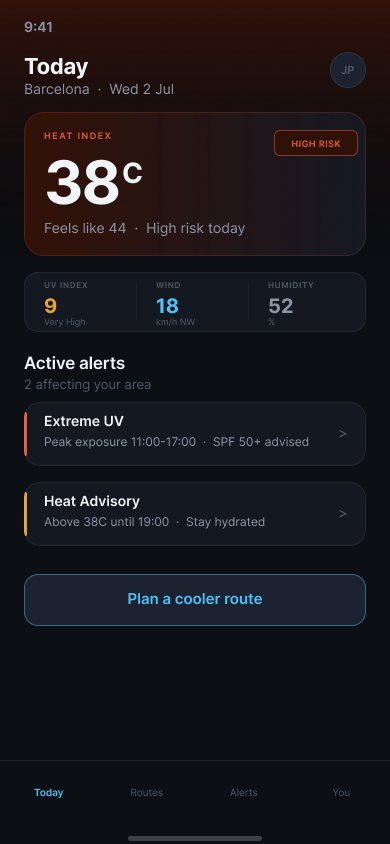
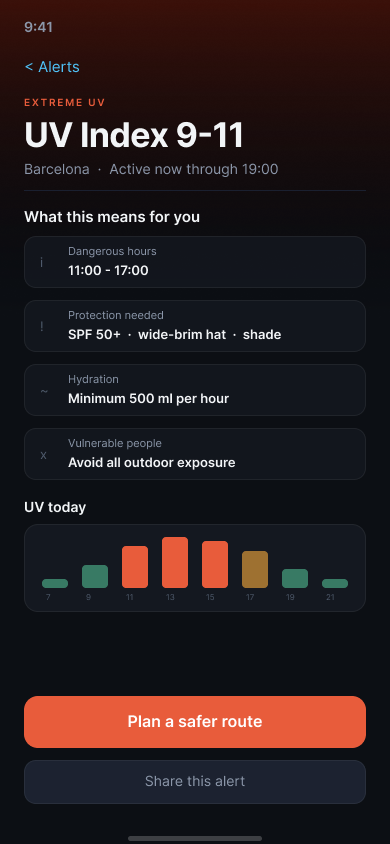
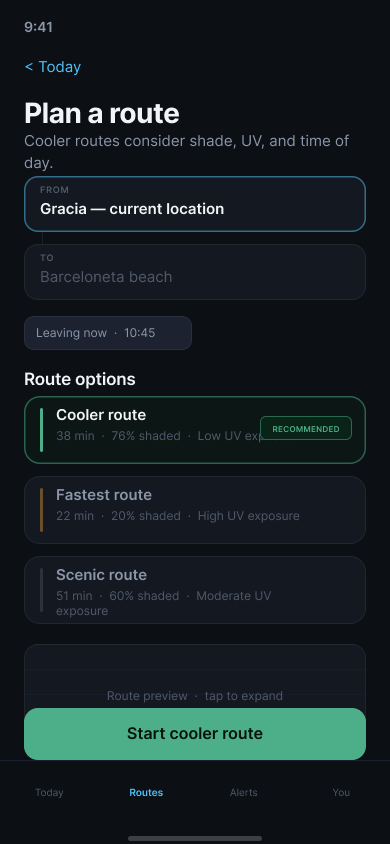
iOS screens · Figma design file · Not yet prototyped or user tested View in Figma →
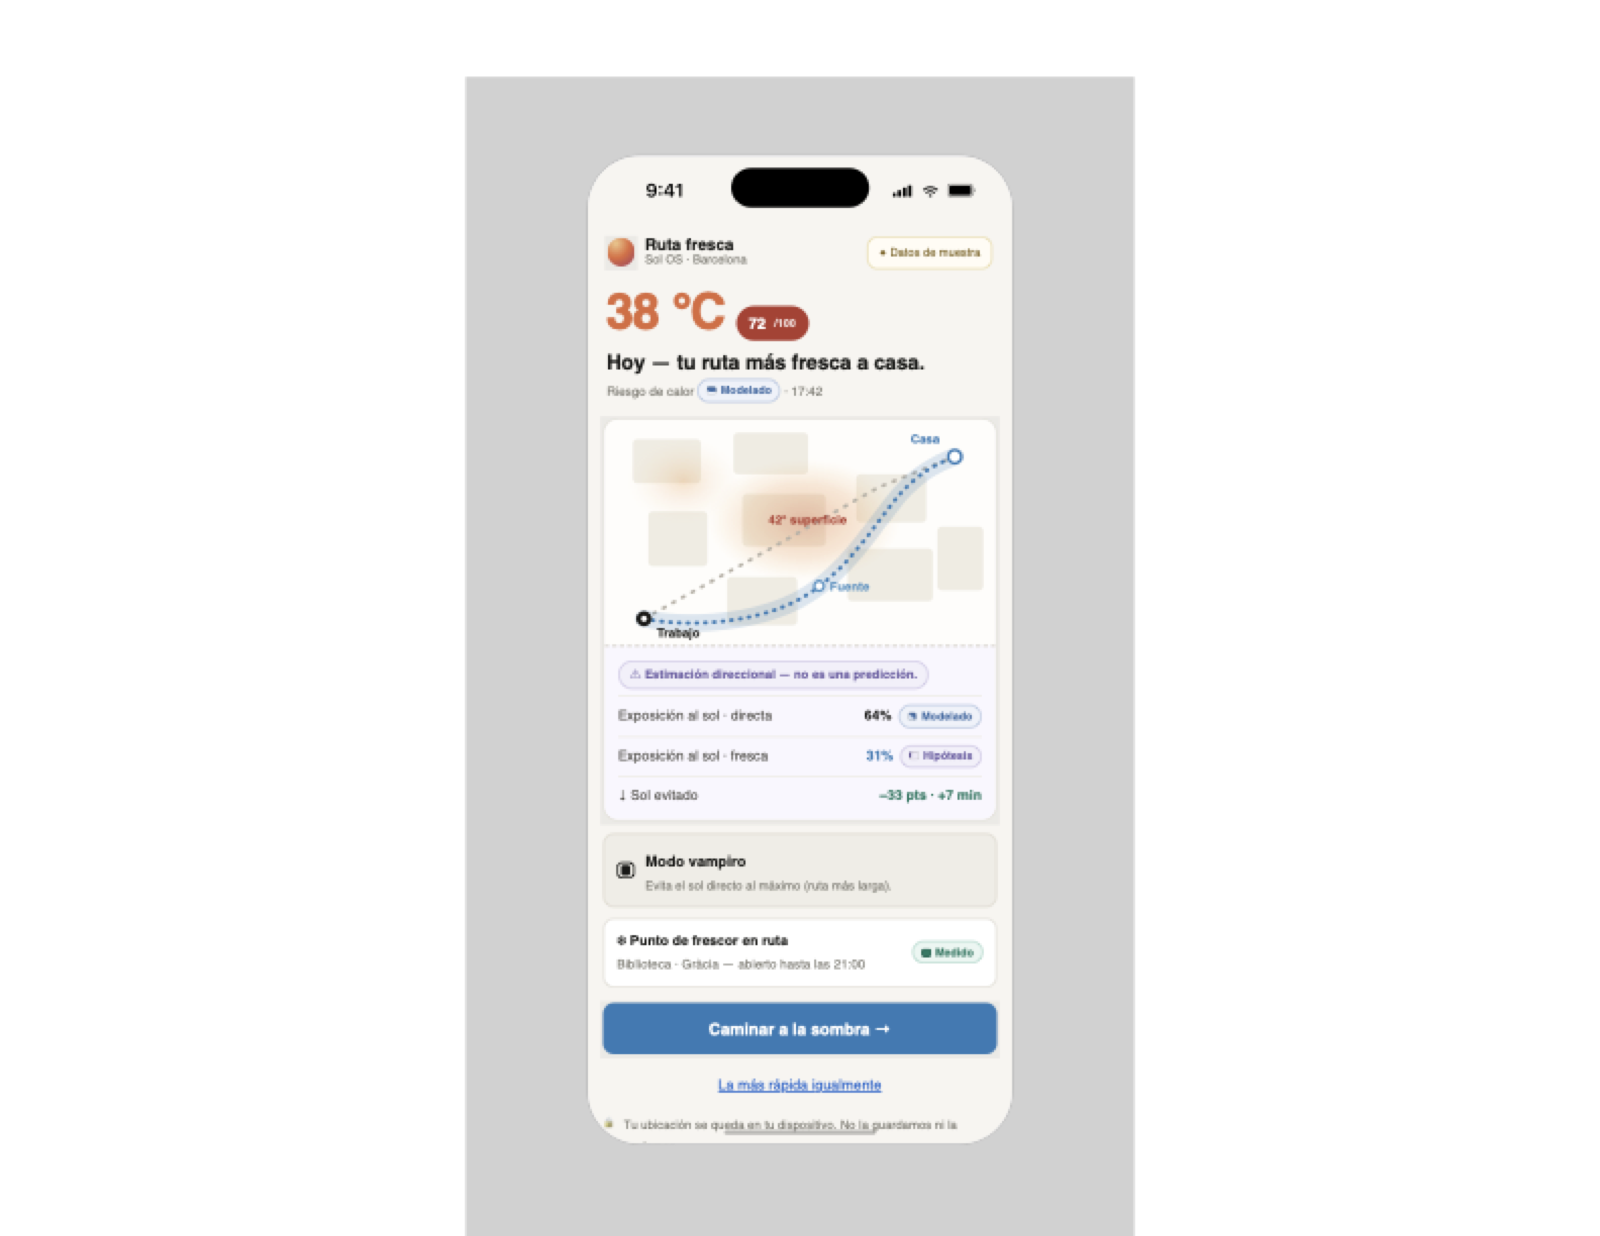
Design Status — Not Yet Validated
The Ruta Fresca flows, UI patterns, and information architecture shown here have not been tested with users. No formative or summative research has been conducted with target populations. The entire product concept is pre-validation — every decision visible in the prototypes represents design intent, not evidence-based conclusions.
Next step: Recruit 5–8 residents from heat-vulnerable neighbourhoods in Barcelona for moderated usability sessions before any development commitment.
Status and Pilot Path
Sol Planner prototype complete — five-layer decision platform, three user roles (Resident / Architect / Planner), trilingual interface (ES / EN / CA), AI climate assistant with deterministic responses, full confidence labeling system, intervention simulator, and site analysis panel. Runs with zero dependencies in any browser.
No new hardware or data infrastructure — Sol OS runs entirely on open data sources already published by AEMET, Copernicus, and the Barcelona Open Data portal. A six-week pilot requires access to two or three planning teams and a commitment to use the tool in actual weekly prioritization meetings. Zero operational disruption.
Barcelona City Council — Àrea de Medi Ambient i Serveis Urbans. Secondary targets: Generalitat de Catalunya (Departament de Territori), and European civic tech networks already piloting urban heat tools in Mediterranean cities.
The prototype, research documentation, and pilot framework are available. To discuss partnership or review the full research: design.perex@gmail.com or book a 30-minute call.